An Inside Look at the Site’s Demographics: A Breakdown of the Readers
As promised several months ago, we implemented demographic tracking on the site to the list of other abilities we have and are now collecting data. Using one popular source, which will improve over time as a bigger sample is developed, the trend that is showing up everywhere is evident. It should only get better as more data points are put into the pool, so I’m excited to see who, exactly, is reading.
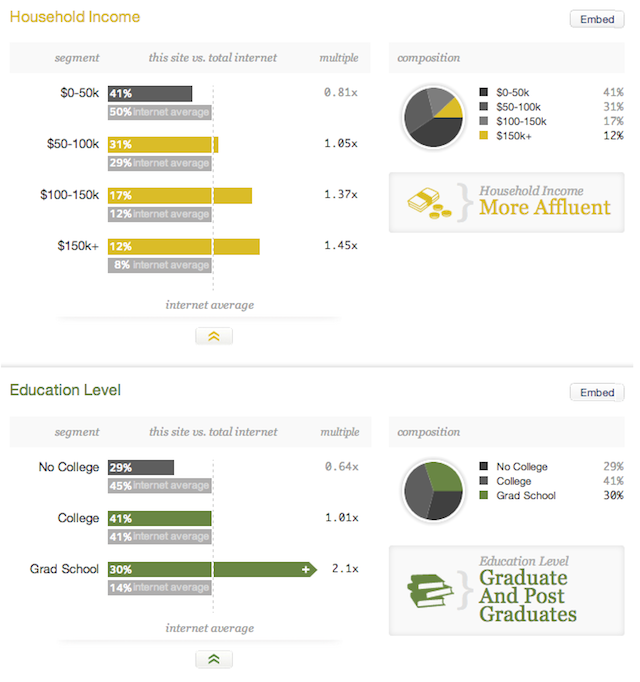
Y’all are mostly young, rich, educated, and interested in science, among other findings. I’ll update with more posts in the future as more data becomes available.
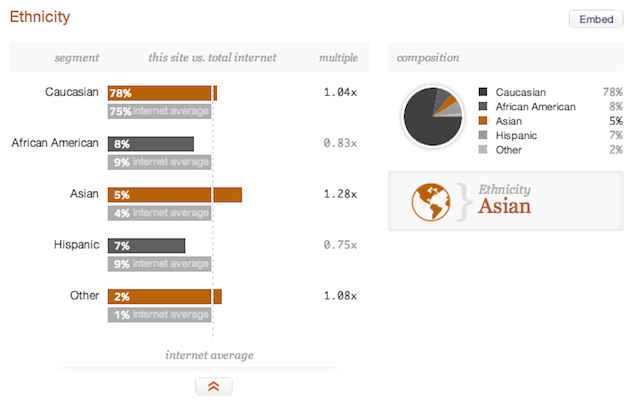
You are disproportionately Asian compared to the general population with a 1.28x greater prevalence than would be expected in an even distribution.
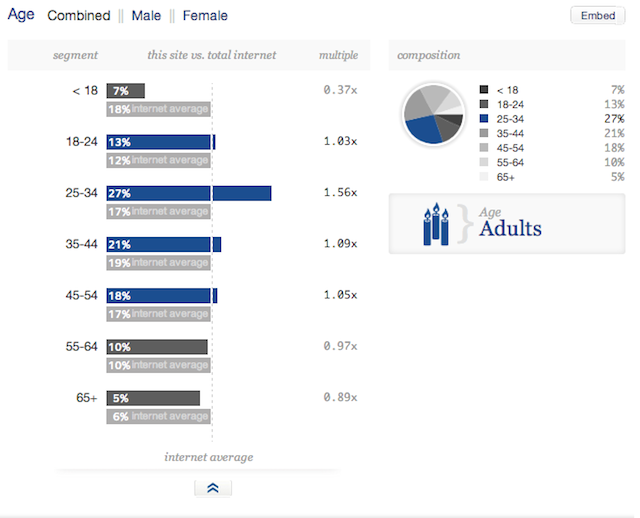
You are also predominately in the 25-34 age bracket. If I were a network television executive, I would be throwing a party right now at these numbers.
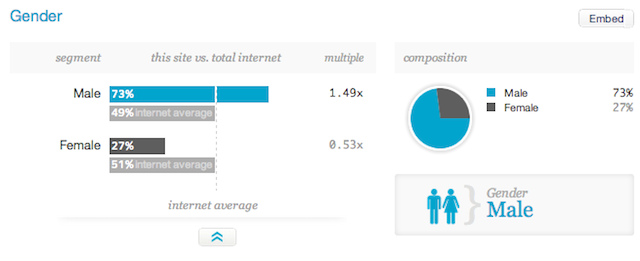
This one is a bit deceptive because it is almost entirely due to the popularity of niche focused posts that involve products men are interested, such as the in-depth tutorial about men’s dress shirts. Strip those out and factor in only the people who return to read the regular content over and over and the distribution looks much more normal. But, right now, the presence of those special articles means you are 1.49x more likely to be male than would be expected.
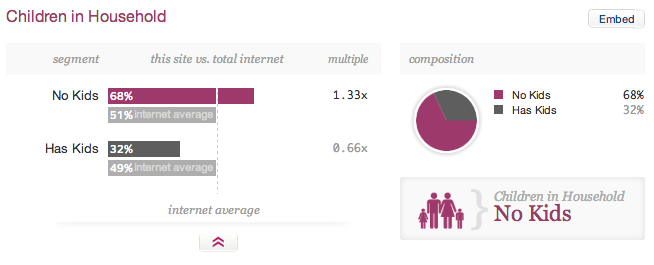
Looking at other data, the lack of children is mostly due to the fact the site demographics are far younger than the typical Internet user. Most of you are still in the 35 years or younger, setting up your households, settling down and getting married, and just now beginning to build a life. We can tell this because your affinity scores for things like “baby” are just as high as the general population, so you want kids, you just don’t have them, yet, due to age and the fact that your demographic (higher education, higher income) puts off child birth until later in life.
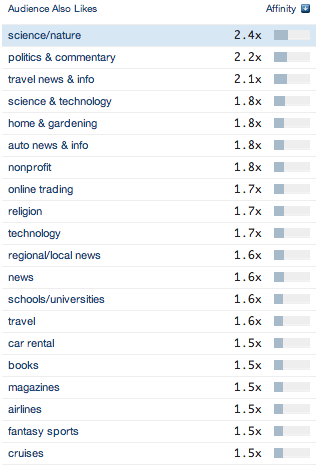
Based on your affinity scores, you read more, you focus on science more, you travel more, you pay attention to your local community news, you are interested in religion, you play in fantasy sports leagues, you like online trading, you are engaged in nonprofits, you garden, you like technology, and you like cars at far greater rates than the typical Internet users.
What about things you dislike? Not enough data to tell at this point.
Also interesting: 65% of you come from the United States, yet you generate 83.51% of the advertising revenue, which subsidizes the thousands of dollars per year it takes to pay the server costs.
The most popular visiting city is New York, which is responsible for 1 out of every 25 global visitors. London is second, accounting for 1 out of every 60 visitors, followed closely by Toronto, Chicago, and Singapore.
As for Internet browser?
- 28.41% of you use Chrome
- 27.42% of you use Safari
- 19.23% of you use Internet Explorer
- 16.24% of you use Firefox
- 4.87% of you use Android
- and the rest use something else
Operating system?
- 55.93% use Windows
- 20.36% use iOS
- 15.11% use Mac
- 6.11% use Android
- 1.14% use Linux
The most popular search term continues to be “joshua kennon” by an extreme margin, which is still just weird to me.
- 25 out of 100 of you come to the blog directly by typing it into your browser or using a bookmark
- 15 out of 100 of you come to the site through a link from another site
- 10 out of 100 of you come through search engines because you typed “joshua kennon” or some derivation of my name
- 50 out of 100 of you come through search engines or social media such as Facebook, Reddit, Twitter, Pinterest, etc.
I won’t tell you the most popular pages or content pieces. That would take too long and there might be some competitive disadvantage.
A considerable percentage of you tend to find areas you like and stick to it. There are those of you who are only interested in the posts about food and travel. There are those of you who are only interested in the posts about finances. There are those of you who are only interested in the posts about politics. It’s a respectable number that if it holds up, it might be possible to sub-track individual demographic components.
That is what is on my desk now. I’m going to dig deeper and see what I can learn from all of this.


