As we approach my 30th birthday, I thought about taking a look at what has happened to the economy of the United States in the three decades I’ve been alive to gain a sense of perspective about where we have been. This is the time period during which I went from childhood to adulthood, and enjoyed the classic Horatio Alger story made manifest; putting myself through college, finding ways to earn six-figures while still in school despite not having a job, finding the love of my life, and settling down to build a home and company that allows me to do what I love every day, all day, without any external non-self imposed constraints on my time.
In very rough numbers (back of envelope estimation ranges), let’s look at the figures. All charts are taken from Google’s interactive public data sets, which are available for free online and taken from major government and institutional sources.
The Short Version: America Rocks
The short version: Despite her problems, America still rocks. She is exceptional. Our economic system is the greatest wealth producing engine the world has ever seen, and it does a fantastic job, as Warren Buffett puts it, of distributing that wealth to a great number of people resulting in some of the highest standard of living that humanity has ever experienced. Looking at the data, my life story, as well as those of my friends and colleagues, are not statistical anomalies.
[mainbodyad]Though there is still massive displacement taken place from the dawning of the Information Revolution (the brunt of which is hitting blue collar, low-skill, and low-educated workers in vastly disproportional numbers), life continues to get better both here and around the world. Some of these outcomes concern me; I am convinced it is now much more difficult for a man of limited intelligence who had a decent work ethic to support a family in manual labor. Likewise, the increased decoupling of integrated zones in city planning arising from the popularity of the automobile, resulting in suburban isolation of populations, has negative consequences for families that aren’t connected to the community in which they reside. Both have important societal implications, none of which are good. Those issues need to be solved but all in all, we are hitting it out of the park, especially compared to our parents, grandparents, and great-grandparents, who laid the foundation for the things we enjoy today.
Consider this: Even if you are in the bottom 10% of income in the United States, you are in the top 1% of income of all humans who have ever lived. Comparably speaking, we are living, working, and witnessing a paradise for which there is virtually no precedent in recorded events of equivalent magnitude. We may not always act wisely with the fruits of this bounty – despite having more free time than any generation that has ever walked the planet, Americans waste all of that leisure to sit on their behinds and watch television – but that comes with the territory of free will.
The bottom line: From a purely rational perspective, given a reasonable probabilistic outcome of random birth possibilities, there is no other nation, at any other time in history, into which I would have rather been born. That is true whether I were white or black, rich or poor, male or female, gay or straight, intelligent or mentally handicapped, a product of an traditional two-parent household or a broken home. With a probability of less than 1 out of 20, each of us who were born as citizens under the banner of old glory, quite literally, won the genetical lottery.
GDP for the United States Over the Past 30 Years
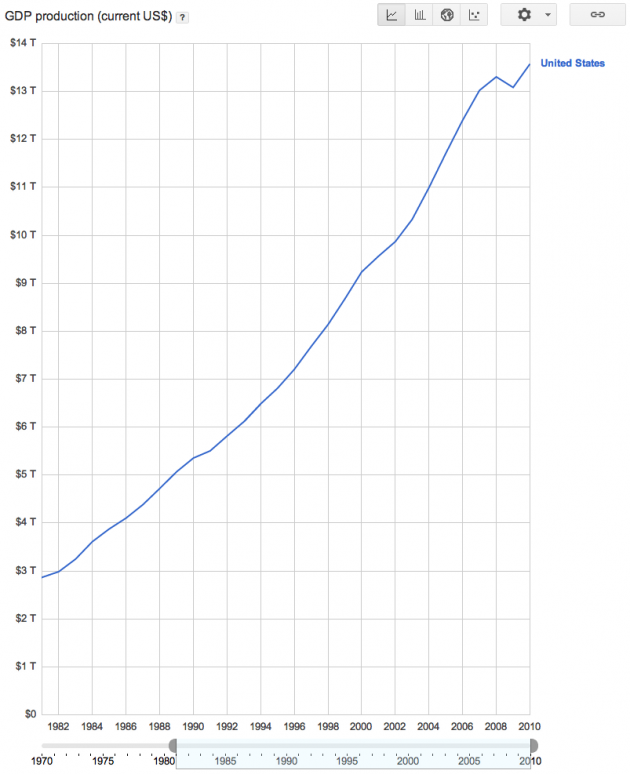
First, examining Gross Domestic Product, or GDP, in current dollars (not inflation adjusted, which we will get to later), the economy increased by roughly 450%, growing from around $3 trillion to around $13.5 trillion. That is an gain of 5% to 6% per annum. (I told you we are going to use really rough numbers – it’s late and I want to get in a game of Civilization V so just look at the charts or use the Google data sets yourself; they are a lot of fun to play around with and you can do cross-comparisons, too.)
The blip you see in the chart between 2008 and 2010 is the Great Recession, which was the worst economic disaster since the Great Depression. We are approaching the three year anniversary of the end of the Great Recession (a recession ends whenever the economy once again grows for two consecutive quarters).
However, the value of $1.00 in purchasing power fell from $1.00 in 1982 to $0.43 by the end of 2010. That is normal in an economy with a fiat currency as a by-product of inflationary pressures. Thus, reconfiguring the data to adjust for inflation, the real economy on an inflation-adjusted basis doubled in terms of purchasing power, which is still good considering the United States was the biggest economic engine on the planet the year I was born.
GDP per Capita for the United States Over the Past 30 Years
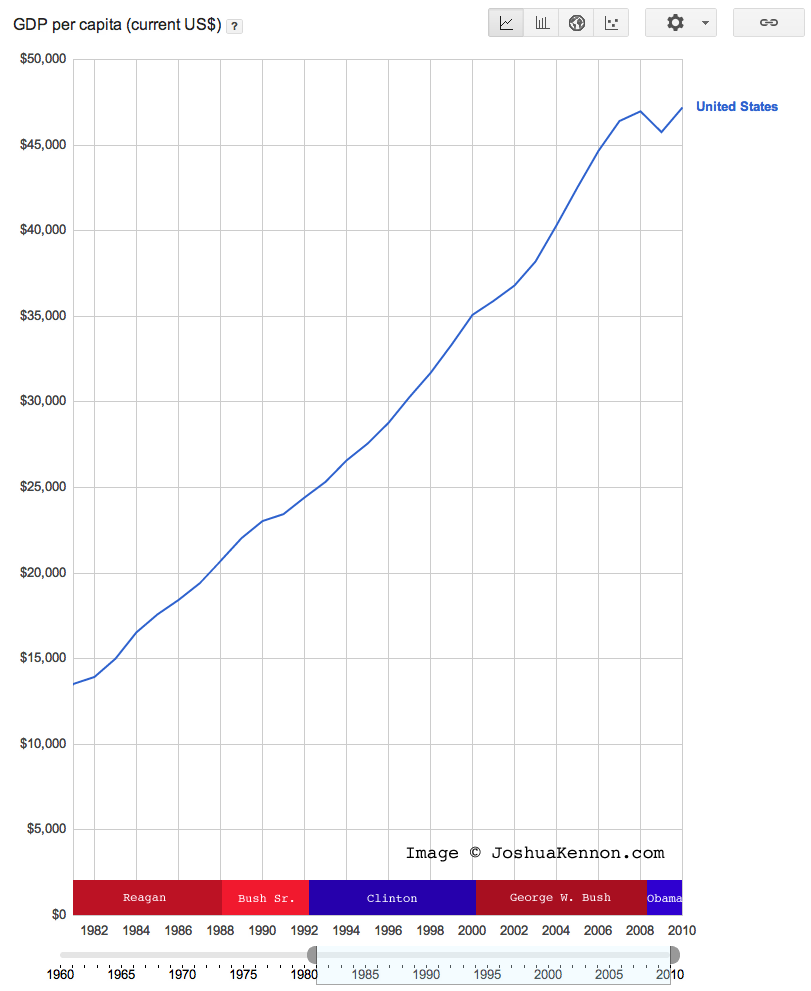
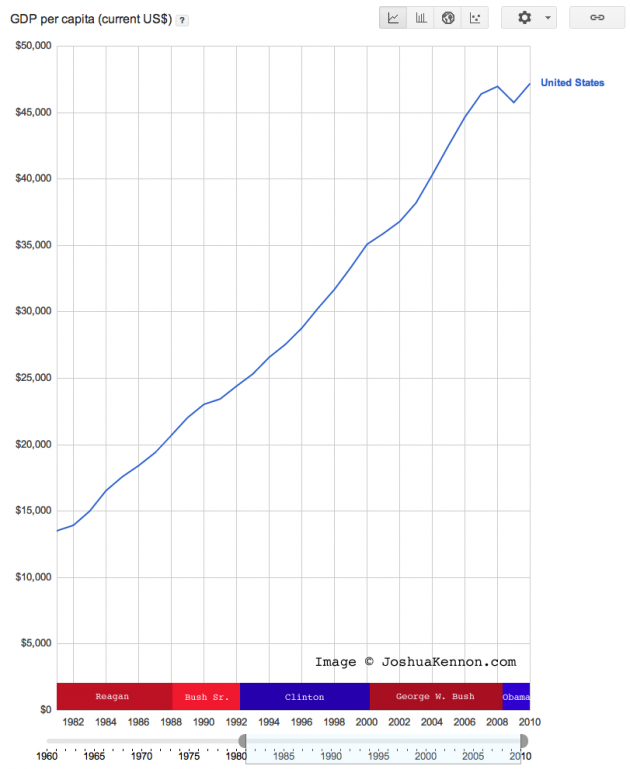
That doesn’t tell us everything we need to know, because the population base changed during that time, as well. There would be nothing spectacular, say, about an economy doubling if the population also doubled. To solve that problem, we need to look at Gross Domestic Product per Capita, or GDP per Capita. This is an economic indicator that takes all of the economic activity of a nation and divides it by the population base. The last time we looked at GDP per capita was a year ago, when we examined various nations and the GDP per capita based on religion. To maintain consistency, we need to look at the figures in current dollars, which we can then later adjust for inflation.
In our 30 year period, GDP per capita has increased shy of 350%. That is not as good as the broader economy, but it is still remarkable for a nation that was already the largest economic engine on the planet at our starting date. But what about inflation? Strip out depreciation in the currency to get a better idea of changes in purchasing power and what do we find? That the United States GDP per capita still improved in real terms, by increasing around 50%. We won’t get into the breakdown of who got that income yet, but the nation as a whole did well during this period considering that it was near the top of standard of living at the starting period, anyway.
United States Inflation Rate Over the Past 30 Years
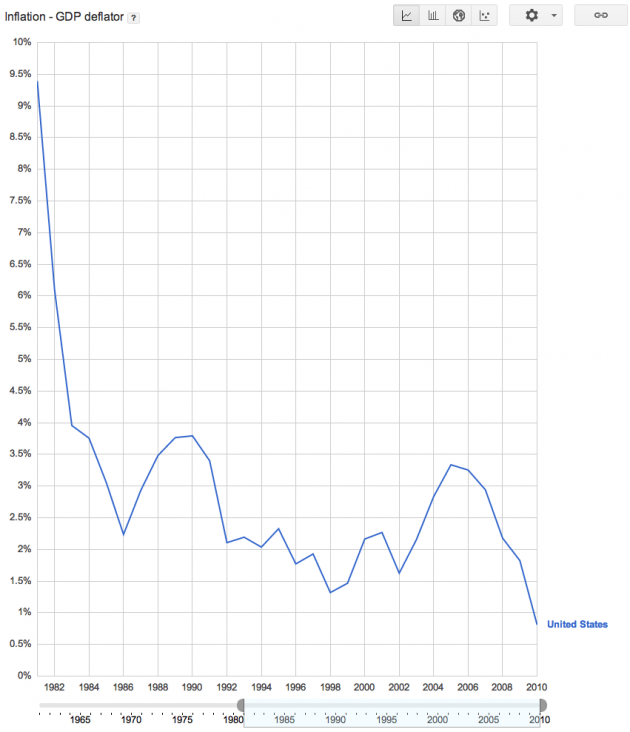
We’ve talked about inflation so now let’s look at the inflation rate over time. At what rate has the United States dollar lost value each year? Recall that there have been changes to the way the Consumer Price Index, or CPI, was calculated during this time frame. Most of them were good, reflecting how consumers actually behave, getting theoretical measurements closer to economic reality (e.g., you replace chicken with beef if the price of beef doubles, and then switch back if the relationship changes).
The inflation picture is much rosier than it was the year I was born. I think we are doomed to suffer significantly higher inflation as a result of the need to monetize the debt to replace the money supply component that evaporated during the bursting of the credit bubble, but from a historical perspective, things are decent. A gallon of gasoline is still cheaper, after all, than it was for our grandparents. It costs less to drive a mile now than at almost any time in the past century.
Life Expectancy Over the Past 30 Years
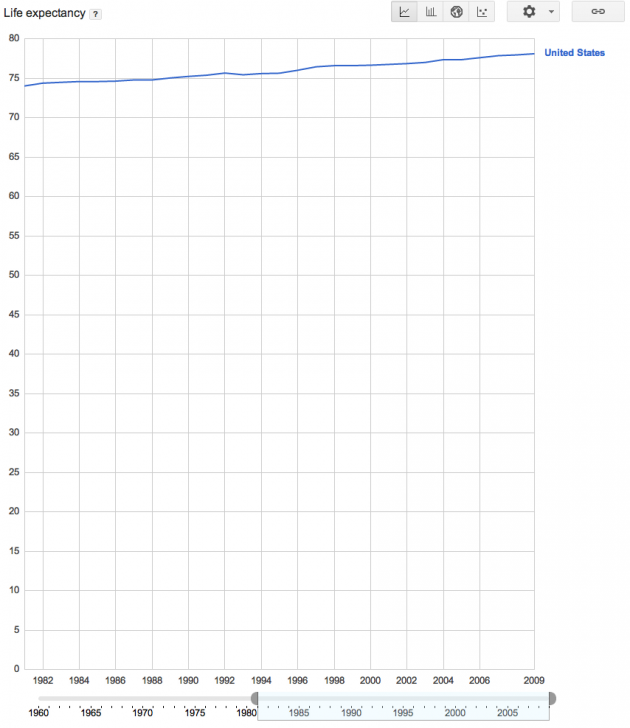
Now, let’s look at life expectancy for the past 30 years. Are people living longer or dying younger?
Life wins. People now live longer than they did when I was born.
Unemployment Rates for the United States Over the Past 30 Years
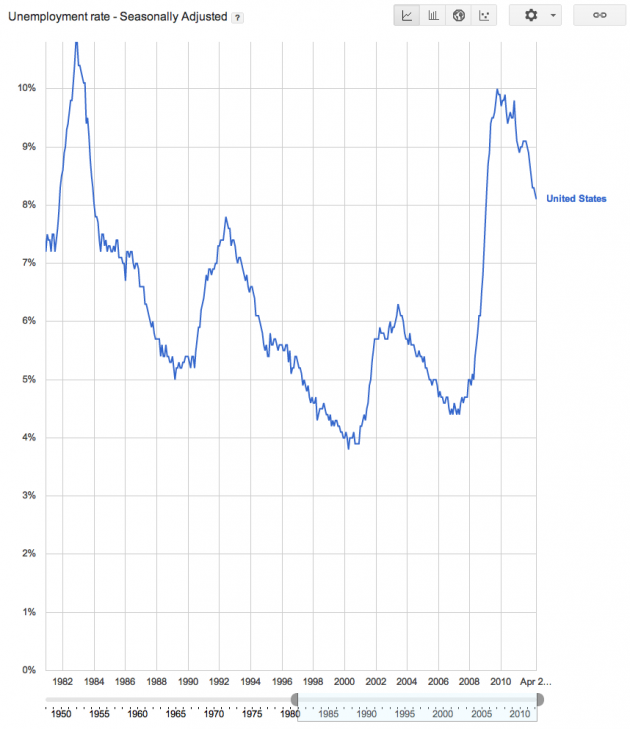
What about unemployment? How has the unemployment picture looked on a seasonally adjusted basis for the United States as a whole over the past 30 years?
A typical unemployment cycle is visible. It is vastly better than the entire 21st century as a whole and the envy of many other nations in the world considering a good economy is expected to have 4% to 5% unemployment for people who are in the process of switching jobs or moving.
Unemployment Rates for 25 to 54 Year Old Demograph for the United States Over the Past 30 Years
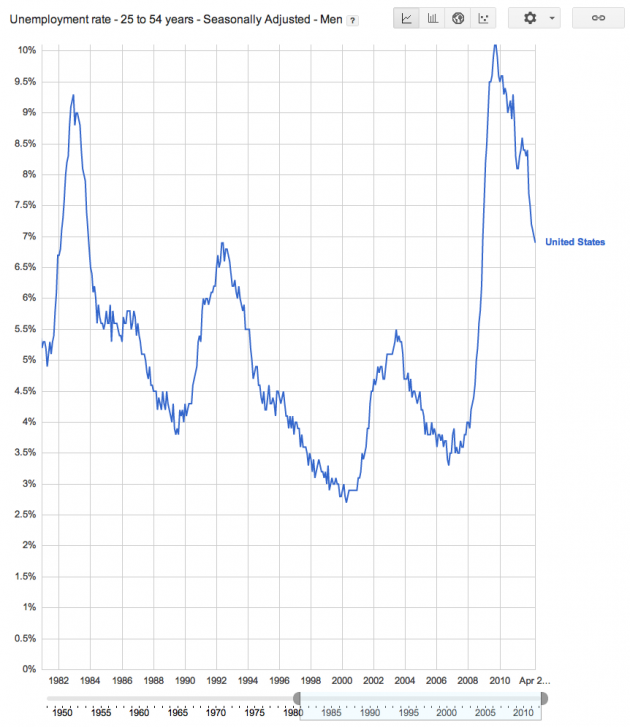
What about the unemployment rate for workers in the so-called prime of their economic lives? This is the 25 to 54 year old group …
Not much unexpected there. The unemployment rate largely mirrors the unemployment rate for the nation as a whole and is returning to the historical trend line around which we tend to bounce as a nation. This is particularly impressive given that we, again, just survived the worst economic disaster since the Great Depression.
Unfortunately, within those numbers there are several interesting stories, namely the gulf that has resulted in some demographic experiencing unemployment rates of 25% to 40%, while other professions have virtually 0% unemployment rates. This is the result of the education gap producing larger differential outcomes as a by-product of the Information Revolution, which is as economically transformative as the Industrial Revolution was. I talked about this last year when President Obama, much to his credit, addressed the real source of unemployment in his State of the Union address.
Internet Usage in the United States Over Time
Speaking of the Information Revolution, what about Internet users?
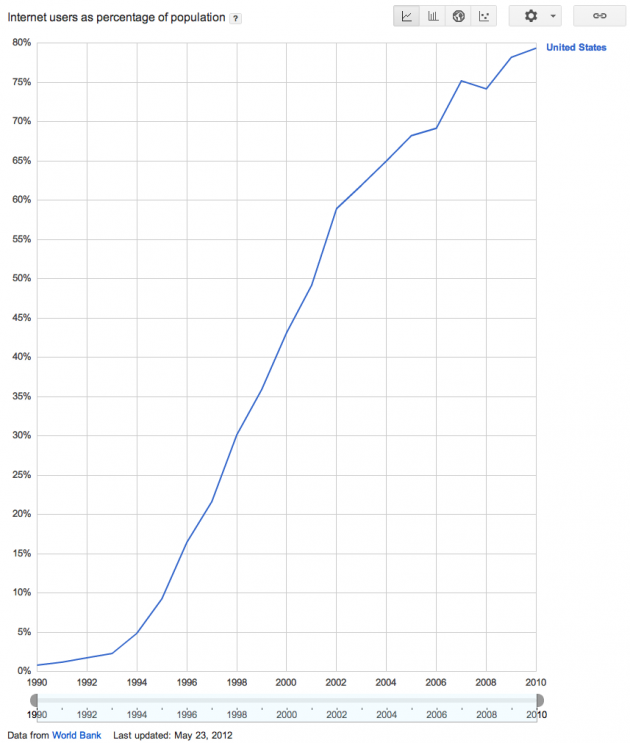
Internet Users as a Percentage of the Population - Notice this chart starts in 1990 not 1982 because there was no Internet, for all intents and purposes as we use the term today, prior to that time.
That is right, kids. For all intents and purposes, the Internet didn’t exist until I was in junior high. Half of the population wasn’t online until I was in college.
Random story: My household was an early adopter because in 1993 or 1994, when less than 5% of the United States used the Internet and I turned 11 or 12 years old, I convinced my parents to go buy a device known as a modem so we could try it out after reading about it in The Wall Street Journal. We went to a little electronic store on the main highway in my old hometown and bought one, taking it home. My parents asked what it did, and I said, “I have no idea but we are going to find out,” and we proceeded to spend the next week in chat rooms and reading messages boards. Before long, the extended members of my family were also trying it and we were talking online before anyone knew what it was. The coolest part was, those were the years when my parents were broke and couldn’t afford groceries some weeks, yet they still found a way to help support the interests and hobbies my siblings and I had. They really were (and are) fantastic.
What About the Downside?
The United States still isn’t perfect. There are several things I would like to see solved, including:
- Regressive taxation on the poor and working class has resulted in a payroll tax burden skyrocketing from $2 for every $100 in wages to $15.30 for every $100 wages in the past 50 or 60 years. That means less cash in the hands of checkout workers, janitors, school teachers, and garbage truck drivers. I think that is bad social policy. The country needs a strong, thriving middle class to create demand. You cannot do it by treating them as geese to be plucked, sucking cash out of their paychecks. We need young families forming households, buying furniture, having babies, and investing in their local communities.
- The switch to 401(k) plans as the central retirement vehicle has been terrible for workers who cannot intellectually handle, or who don’t have the emotional capacity to understand, the process of investing. I think the societal costs are immense. The pension system of old worked much better for the typical employee as a whole and I would love to find a way to go back to a pension scheme so a guy who is great at, say, roofing houses can focus on his job rather than managing his money. Not everyone is like me, considering it fun to pour through the 10K of a bank holding company and find a bargain. We can’t expect everybody to be. They need to know, “I work [x] years, I fall in [y] pay scale, and for [z] years following retirement, I will get a check for [$___]”. Then, they don’t have to worry about the Dow Jones Industrial Average crashing.
- Student loan bankruptcy laws need to be reformed. It is immoral and unethical to create debt slaves with no mechanism of escape simply because the bank lobby managed to get a bill passed a few years ago that made it next to impossible for student loans to be discharged in court. There is nothing special about student loan debt. It should be treated the same as credit card debt, mortgage debt, and consumer debt.
- The education system needs a complete overhaul. I am rich in spite of my schooling, not because of it (college being the exception – I loved my college experience and education). The current model of education is designed for the Industrial Revolution when people were coming off the farms and into the factories. It groups students by age, not topic mastery skill level. It results in great teachers being paid far less than they are worth and bad teachers getting paid far too much. It creates a caste system where children of wealthy parents have much better inherent advantages than those of poor parents. We need to look at people like Geoffrey Canada of Harlem’s Children Zone and the work he is doing in early childhood education. Furthermore, we need to accept that not all students have the same learning style and not all children have the same cognitive abilities in the same discipline areas; some excel in mathematics, some in literature, some in the arts, some in athletics. Kids are not pegs to be shoved into pre-cut molds.
In any event, it is great to be an American. I love this country. I love what we are capable of, I love our history despite dark periods that should never be forgotten to avoid the same mistakes, I love that we continue to get closer and closer to equality, fairness, and individual freedom, and I love that anyone who wants to become a success here, can.
Opportunity drips from the trees here. To paraphrase Bill Gates, it is not your fault if you are born poor in the United States but it is your fault if you die poor and you wanted to be rich. (Not everybody wants to be, by the way. It’s a mistake to think otherwise. Being rich doesn’t make you morally superior or better somehow.)
The first step to grabbing it is to drop the entitlement and realize that no one will give you the life you want. You have to earn it for yourself. None of us are entitled to anything. If you are unhappy, fat, chain smoke, divorced, use drugs, or work in crummy jobs, you and you alone have the ultimate responsibility to fix it. The beautiful thing about life is we all have free will. If you want a different outcome, change your behavior. To the extent that your life can be controlled, and besides any outside-context problems, your life reflects how you allocate two things: The 525,600 minutes you are given each year, and every penny that passes through your hands. Otherwise, stop blaming someone else. It doesn’t even matter if it is society’s, your parents’, your teachers’, your friends’, the government’s, your spouse’s, (insert favorite blame entity here) fault. It very well could be! But it doesn’t matter. That is inconsequential. It’s your reality. If you don’t like it, change it.
[mainbodyad]


