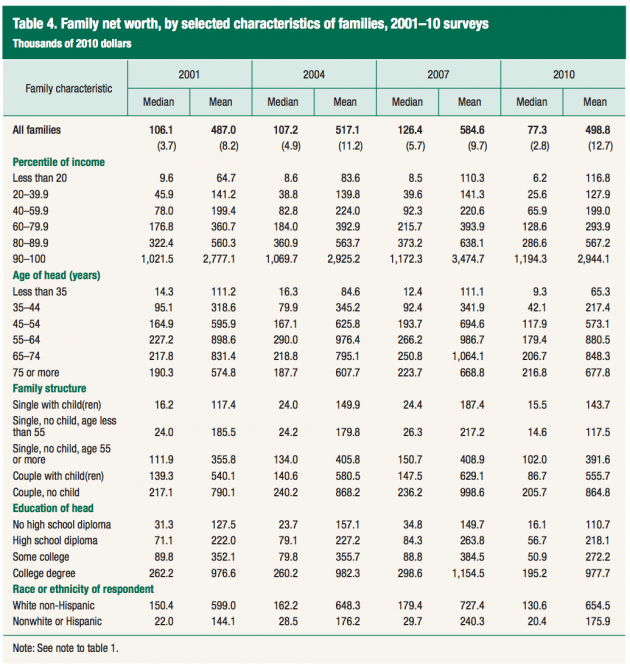
Interesting fact: Do you want a financial “A” in life? To achieve it, and rank in the top 5% of households (making you richer than 95 out of 100 families), you and your spouse need a combined pre-tax income of $205,300 and a net worth of $1,864,100.
[mainbodyad]That is according to the triennial Survey of Consumer Finance, which was released by the Federal Reserve a couple of days ago. It’s one of the best sources of information available from any source on the health of the average United States household. Flipping through the data and looking at the net worth, income, and demographic statistics is interesting. Here are a few of the highlights.
Remember: Median is the figure that matters because it is the point at which half of people are above you and half of people are below you. Mean, on the other hand, is pointless because it doesn’t tell you anything of value. If you and Warren Buffett were in a room together, the mean net worth might be $22 billion but that doesn’t do any good in understanding how the money is distributed. Ignore mean. Focus on median.
Household Income Breakdowns
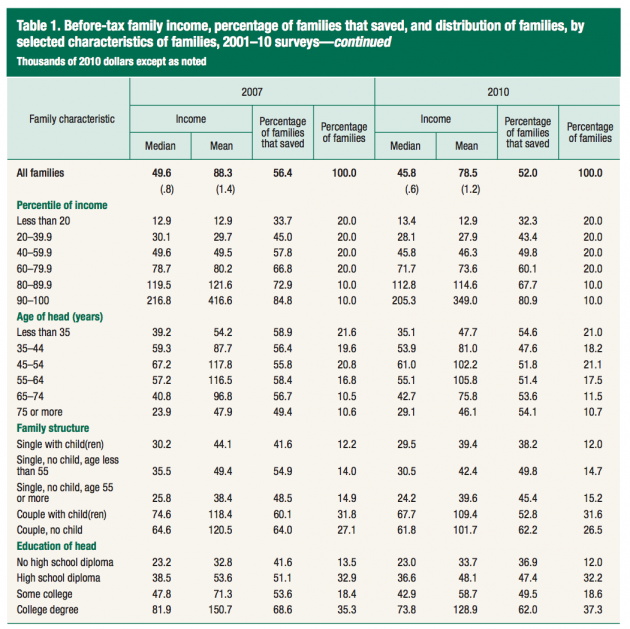
Before Tax Family Income, Percentage of Families that Saved Money, and Other Information 2010 Survey of Consumer Finances Federal Reserve Income Chart
The median family in the top 10% of household income in the United States in 2010 earned $205,300. At that point, half of the people in the bracket earned more, half earned less. That is $17,100+ per month in pre-tax income. Obviously, simple math tells you that is the cut-off point for the top 5%, as well.
The median American household earned $45,800 pre-tax. So if your family generates more than $3,817 per month in pre-tax income (before payroll taxes, retirement savings, and other reductions), you are in the top half of society. You are in the richest 1 out of 2 Americans.
Household Net Worth Breakdowns
What is fascinating to me is the fact that for the 35-and-under household group, median net worth is only $9,300. That is all it takes to have a higher net worth than half of people in the same demographic. It’s insane. Short of catastrophic health problems or unexpected tragedy, the only reason someone should have a net worth that low by 35, a full 17 years after they entered the work force, is because they spend too much money. This is a cultural problem. Thriftiness, self-sufficiency, and independence are not valued and taught as they once were.
Source of Household Income By Demographic
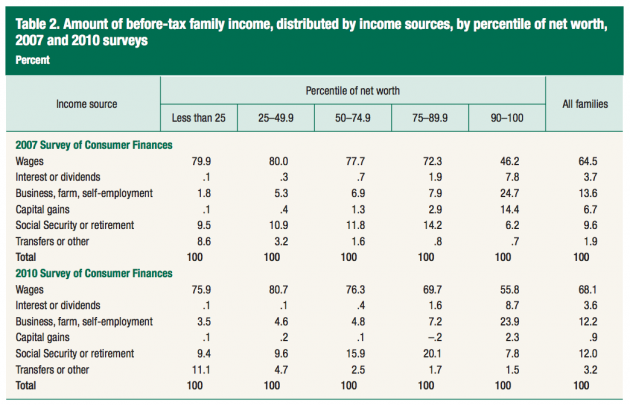
Now, let’s look at the source of income based on distribution of net worth percentile. No surprises here. Back in 2007, nearly 47¢ out of every dollar in the top 10% of income comes from either interest, dividends, business income, farm income, self-employment income, and capital gains. In the bottom 25% of income, that is only 2¢ out of every dollar. Fast forward to 2010 and the figure had fallen to 35¢ out of every dollar, mostly the result of lower capital gains on financial assets, such as stocks, which were hit in value.
Looking at it another way, back in 2007, the bottom 25% generate nearly 80¢ out of every dollar by selling their time. In the top 10%, only 46.2¢ of every dollar is generated this way. In 2010, the figures were 76¢ and 56¢, respectively.
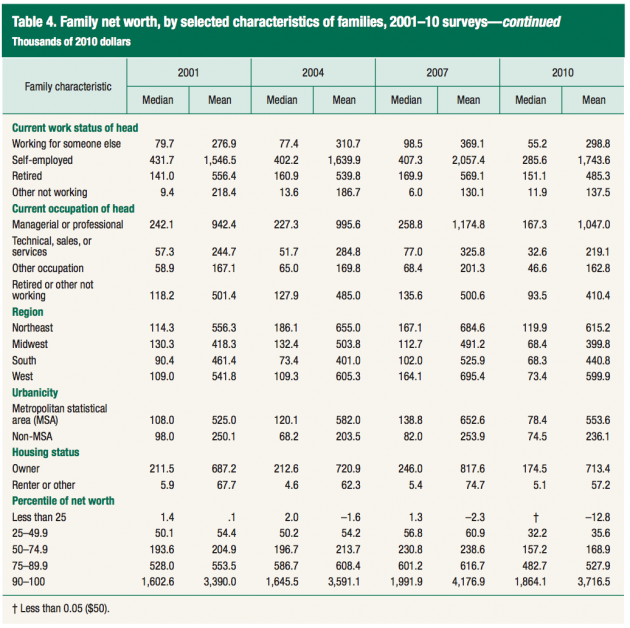
Here is another interesting find … as per every piece of research on the rich, median net worth for those who are self-employed is vastly higher than for those who work for someone else. In fact, the median self-employed person typically had $5 in net worth for every $1 in net worth belonging to those who worked for someone else. That is a massive difference. If you have the talent to run a business – and many people do not – the rewards can be enormous. If you don’t, you will probably lose everything and end up broke.
Also, the median net worth to rank in the top 10% of households is $1,864,100. Common sense and basic math tells you that if this is the figure it takes to have more than half the people in the top 10%, that is the cut-off entry point for the top 5% of net worth. In other words, if you have $1,864,100 or more, you are richer than 95 out of every 100 households, but we already discussed that figure.
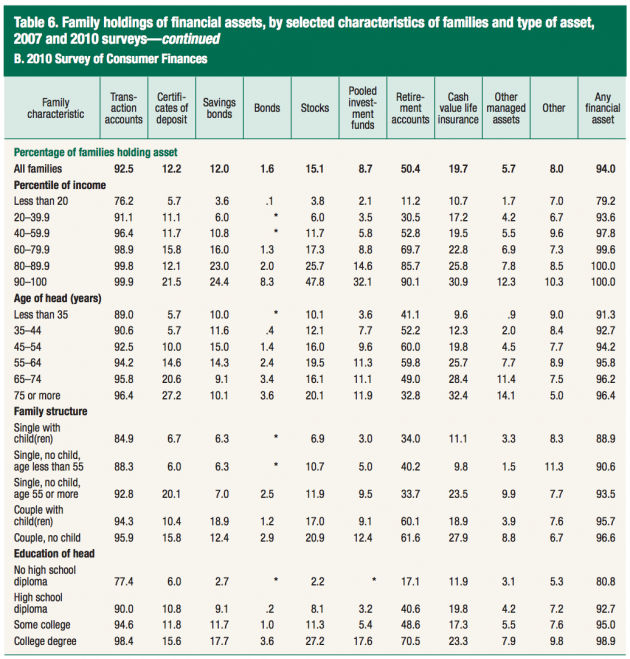
Then, you see the insane part of it all … at least, if you understand compounding. Roughly 9 out of 10 young people 35 and younger don’t have a stock investment account. At the very moment in life when time is at its statistical greatest, when stocks and long-term investments have their most value, they are completely neglected.
In any event, the report is full of great information. I am going to be studying it sometime in the next few days. The composition and balances of debts are particularly interesting.
[mainbodyad]


